This time we would check the second down wave between Oct 2007 and Apr 2009 on the weekly chart. It is clear that there is SanZun (three top). After dead cross it taken 66 weeks to lowest price.
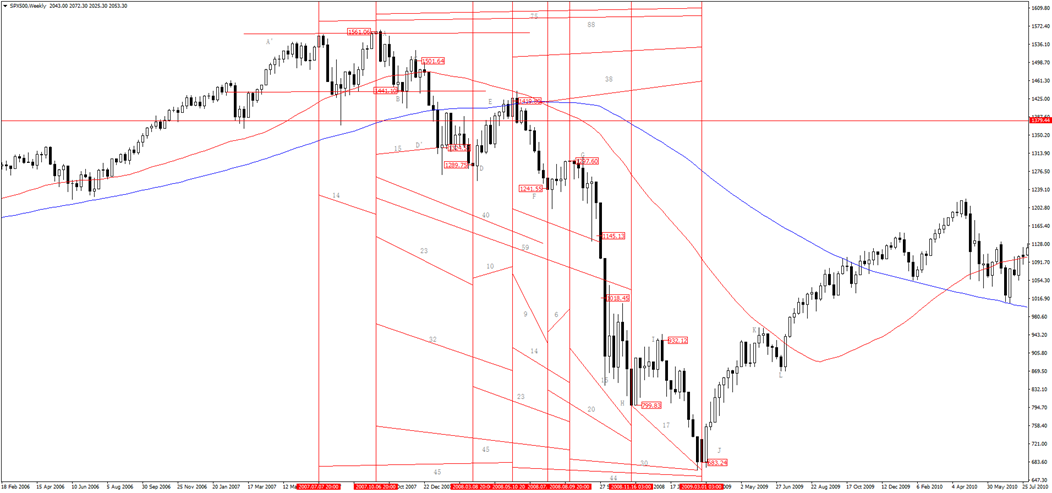
So from the 1st top to the lowest point J is 116 weeks. Just use A-B-C wave we got calculation result as:
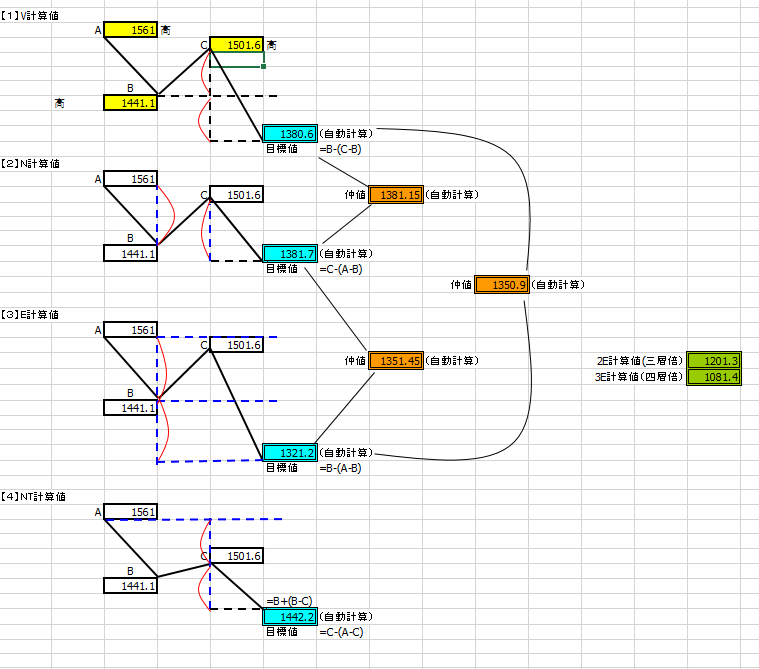
In fact the point D’ had arrived the N value even E value not the point D, we need catch there is a mirror symmetrical by point A and there is A’-A(14) = A-D'(15). This A-B-C-D’ wave was arrived target price early because this is SanZun break. Then it returned at 32 weeks but this is not important now. Now we check where the wave A-D-E will go on?

Still calculate it, now A-D is 23 weeks and D-E is 10 weeks, base this time distance, we should guest the future point is 10 or 23 or 33. But it is really difficult with down mode, you can catch E-F (9) is equals 10, and D-G (23) is equals 23 and the front of H is 33.
E-F (9) is half distance with A-D (23) but point F was not arrived the N value. When arrived N value is 21 weeks after point E and it is 22 weeks when arrived E value and this two numbers are all double the E-F (9) distance.
At last the second down wave had arrived at 683 and more low than 2E value. In this mode there is A-E (32) = G-J (30) and A-G (45) = E-J (45) = A’-E(45) also A-D (23) = D-G (23) = F-H (20) .
So we get some result:
1: It will be taken 79 weeks to lowest price after dead cross at the first cross and second is half (38).
2: It will be taken 110 weeks from highest price to lowest price at the first cross and second is 1/3 cut off (75).
3: The first wave is always nearby the basic number 33 base define.
4: There is 9 down 17 up 33 down with first N wave.
5: The third wave of N wave is always half time of front waves.
6: If the first N wave is arrived N value then the unit N wave will be arrived N value too and more.
Base this, we make some suggest that after the third dead cross there will be one down trade way and we could keep it about 60 weeks more than one year and the target price is could seem to about 700 pips (we will check it after when N wave is disappeared).
There is another interest thing, after point J the market turn to up trade way with fall SanZun break.
- Weekly chart is based on FXDD data and I was very pity this data is wrong because there are some double data between 2008.6.1 and 2010.4.1.
Next time we will check the daily chart to confirm the down mode.
(To be continue…)