Hi Bob, I know you will notice my articles even I had refused your ask. There is a law that you who is living in US and Canada could not join us to make some trade, and you think too hard and important about money. Of cause that is your habit and your education, but you need accept something unconditional if you really want follow a master to learn one skill. Think about it, how you face it that 10 or hundred dollars less per pip when you are in trading? You need let this heart down and let this thing which you think it is very important go away.
This article is for you. At first it is you let me know this symbol SP500. If not you, I really never notice this symbol which is not activity and average just in 20 pips per day.
There is a report that give us a technical signal. In weekly chart, there are only 2 times when MA50 is dead crows with MA100 in this twenty years and now we will face the third time. After every time after dead crows is disappeared, the market is go on down trade way.
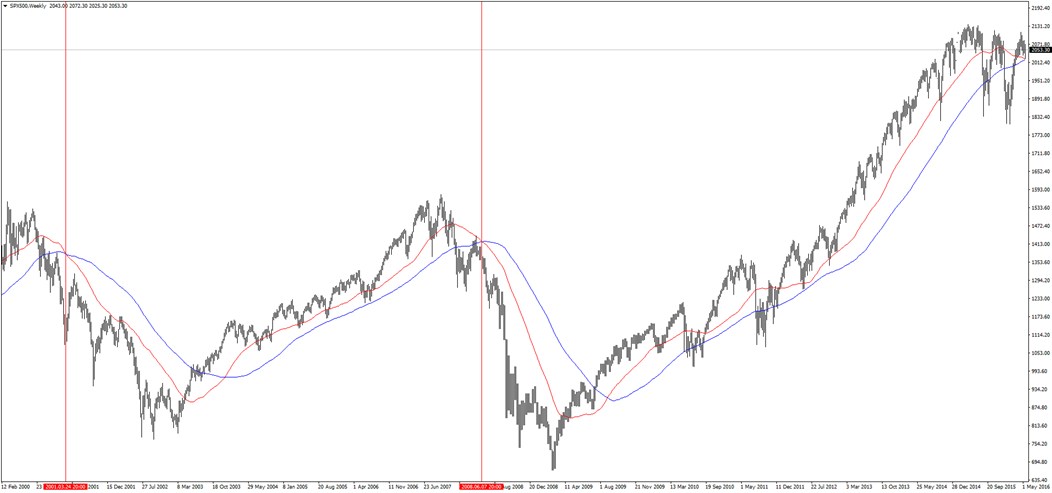
As you know, Ichimoku is made by on stock not forex so there is no any explain for down mode. So we need try find the down mode.
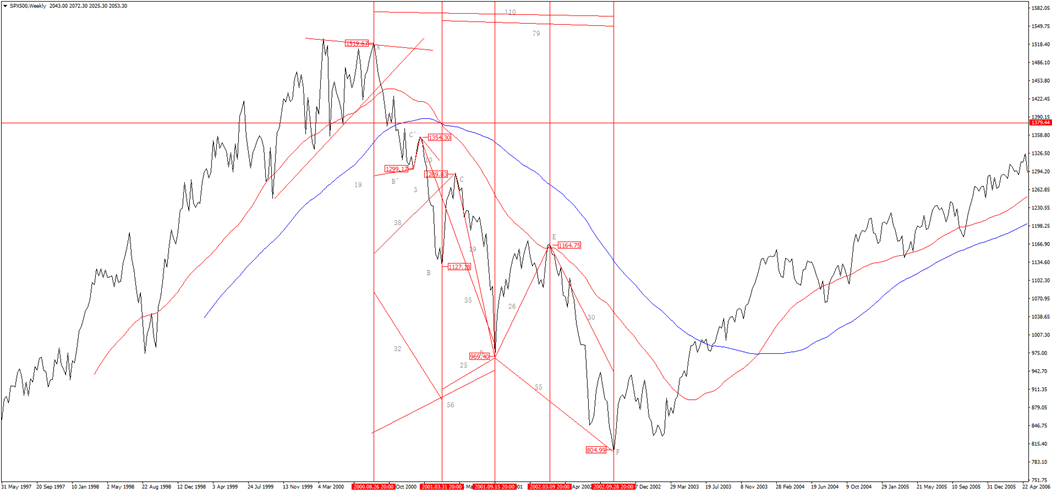
Look at first down way. Point A is the wave’s begin and point F is the wave’s end. The distance is 110 weeks and the dead cross point is 79 weeks away to point F.
With the first wave A-B’-C’, we calculate as:
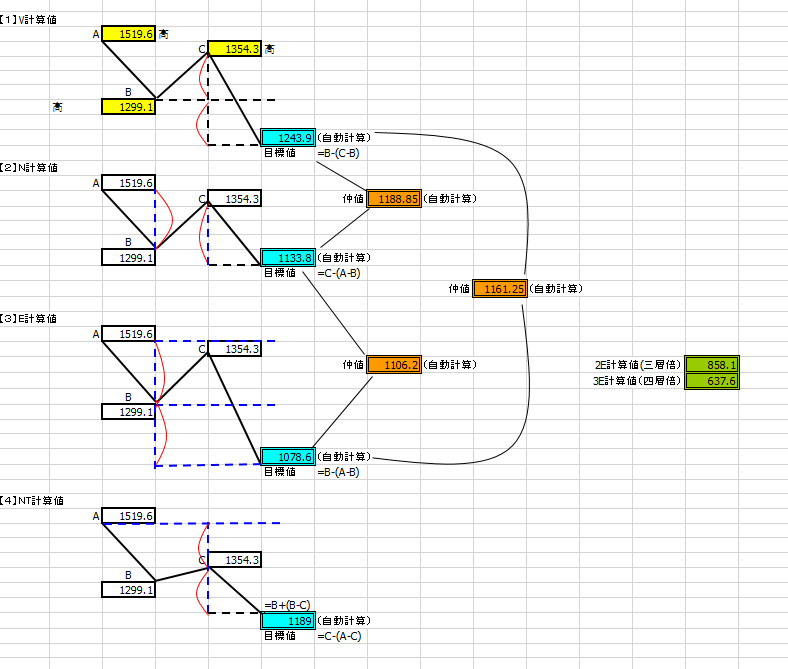
The N calculate value is 1133.8 and it was arrived at 1127.1 in 32 days. We need notice there is one thing C’-B is half with A-C’. Now A-B is 32 days as an I wave just between point A and the first dead cross.
Continue find second N wave, now is A-B-C-D, C-D (19) is still half with A-C (38) and the target price of D (969.4) is low than V value.
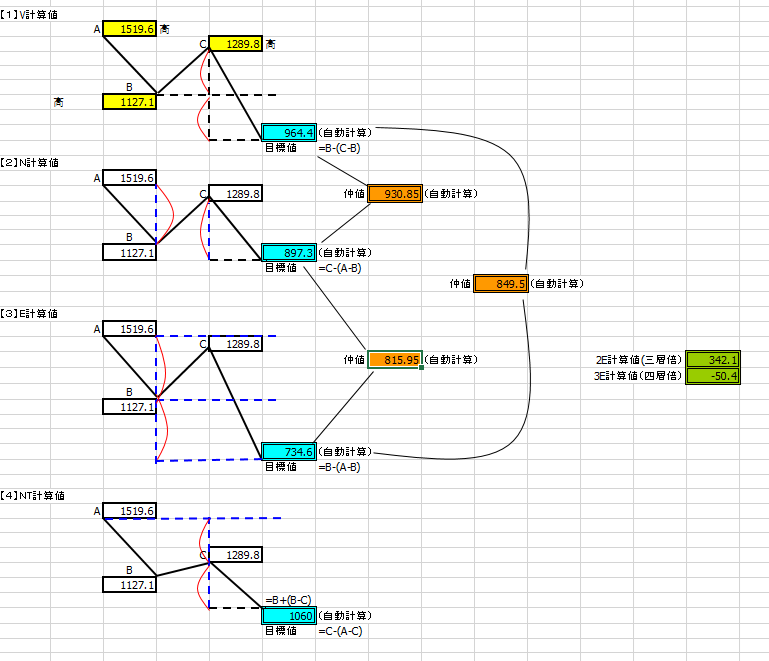
The second N wave is go on with C-D-E-F. In these three calculate table, table 1 ‘s 2E value 858.1, table 2’s 849.5 and follow table’s N value 844.3, they are so close that we could decide this value is our target price.
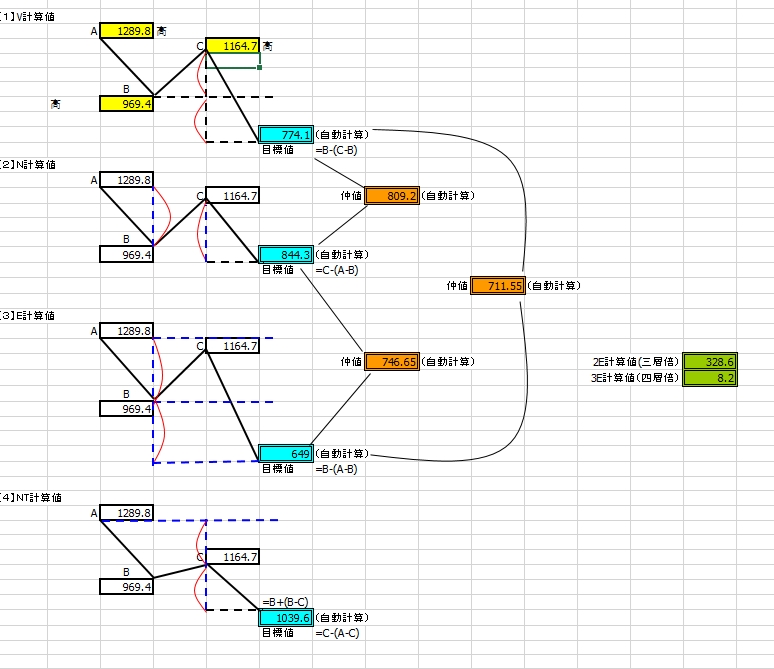
In fact, the target price (804.9) is low than N value and nearby average value with N value and E value (809.2). And with time, A-B(32) = E-F(30) and B-D(25) = D-E(26) and A-D(56) = D-F(55).
Ok, now we just want hold these number and go to the second down way.
- Weekly chart is based on FXDD data.
(To be continue…)
Fantastic article once again! Very excited to see more on the subject.
Many Thanks!