Everything is will happened on reasons. There always had why when now is displayed.
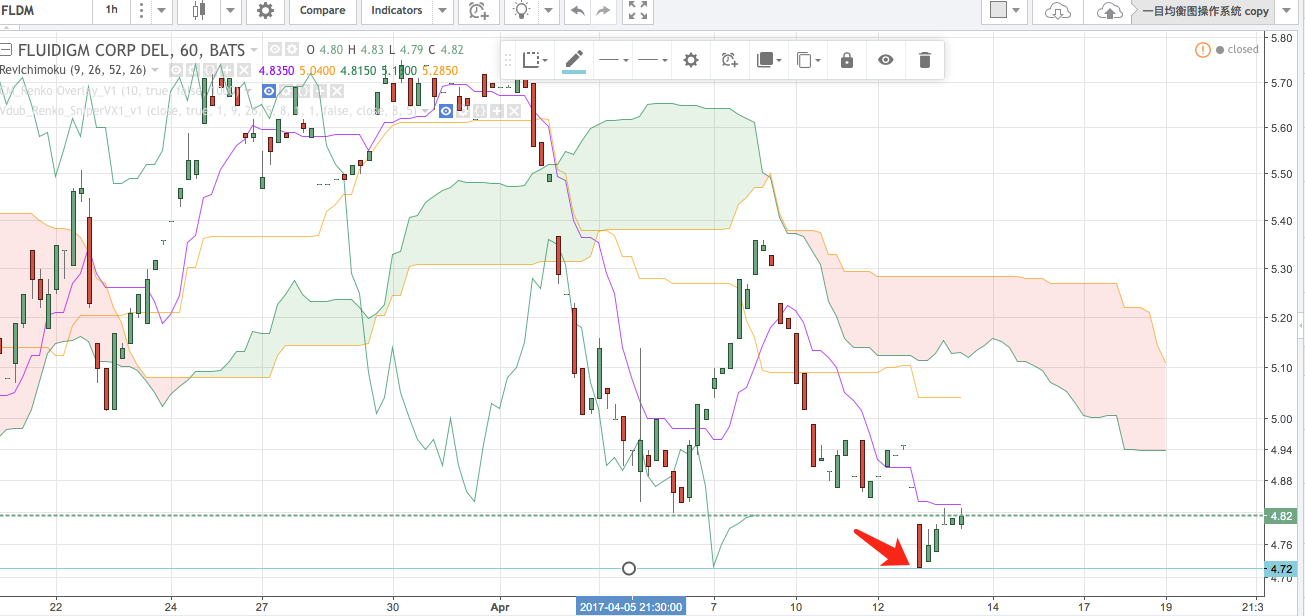
Some analytical for FLDM. There is completed with a circle.
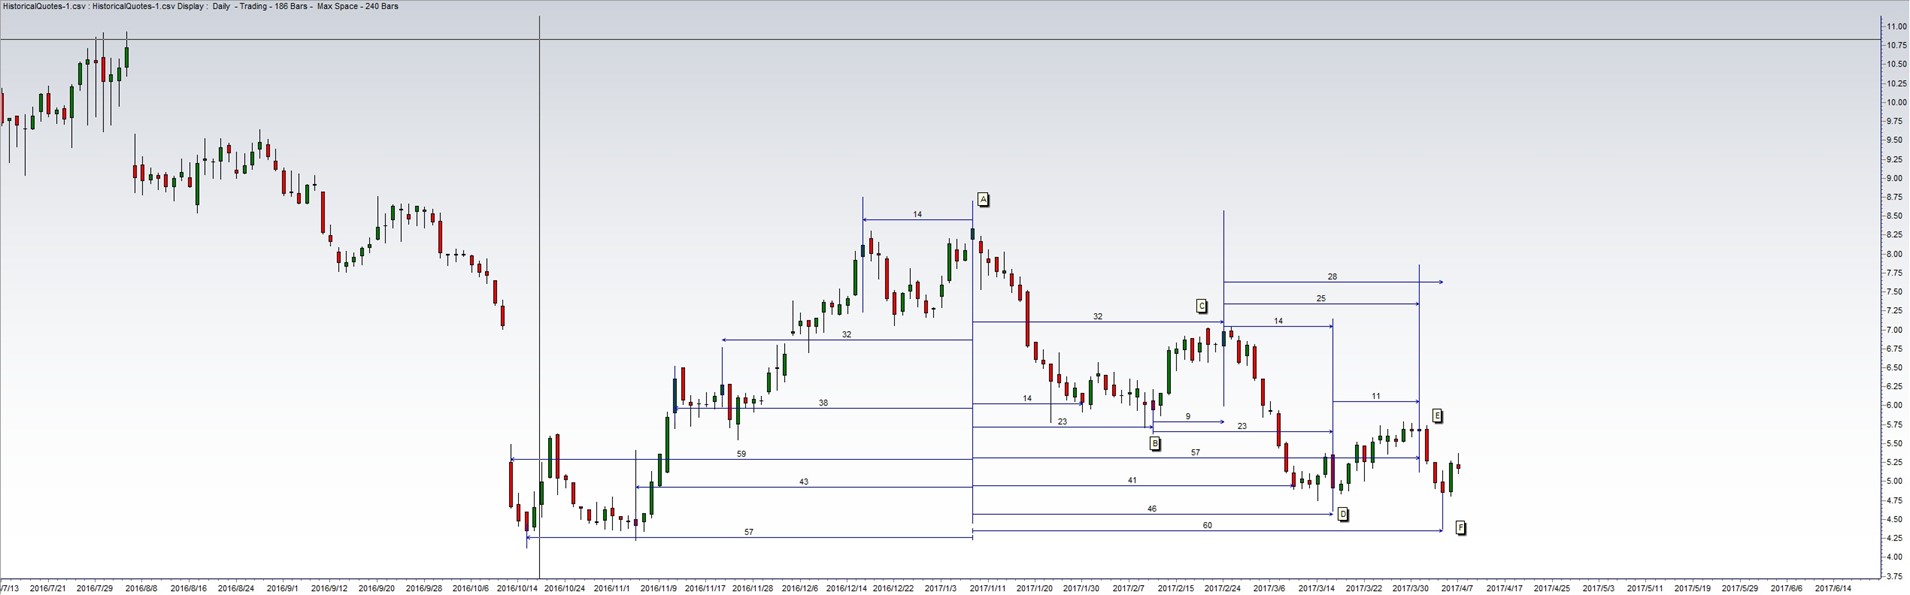
A clear pattern is AB = BD in 23 and the other wave pattern AC = CF’ will be in 32. F’ point is not marked.
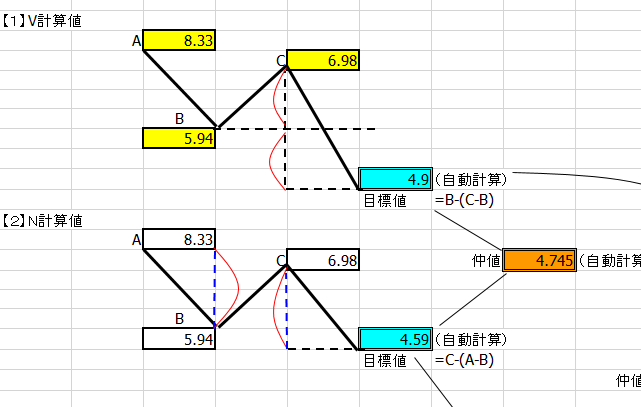 Point D is V value target, so next if it is still down it will target to 4.75 also N value.

After Oct 13 last year (what was happened? With so large window…), there is 59 to A and AF is 60, we know 65 is important and just AC = CF’ in 32 with V wave = N wave. So after 3~4 days, there will be lowest point at Apr 13.
You can believe it if the open price is lower than last week’s close in Monday.
Be good luck!
As result add the chart at now (Apr.13)
Fantastic analysis! Thank you.
Haha, Do u had great get?
I bought a little early. But my average is pretty good. Where do you see it going from here? Based on my analysis I think we could go to $5.60 between April 26th & May 8th. Would love to see a follow up chart when you have time. 🙂
Next time I would try to read the future.